Freelancer, Matlab programmer,
Comsol programmer, Physicist
vedenev.maxim@gmail.com
I don't work as freelancer any more
Last site update was in 2013
Just keep the site alive for history
skype messenger:
| Matlab projects |
 |
| Java projects |
|
| C# projects |
|
| C++ projects |
|
| Comsol projects |
|
| Physics projects |
|
| My Education |
|
| Payment methods |
|
| My resume |
|
| My videos |
|
| My ideas |
|
Matlab projects
| ||
| | ||
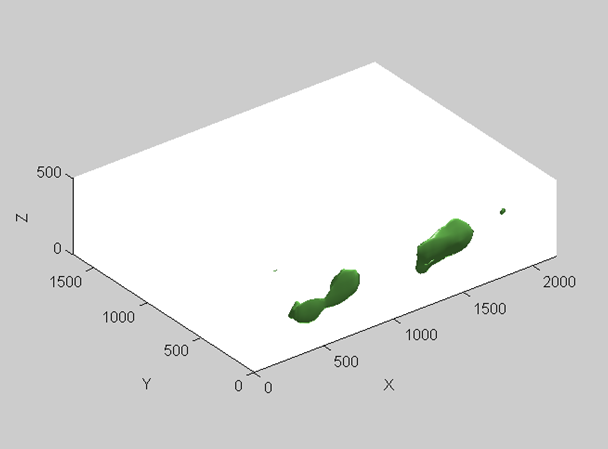 |
This is search of 3d pattern in 3d data. Two methods was used 3d convolution and moving correlation. The response is represented as isosurfaces. |
|
| | ||
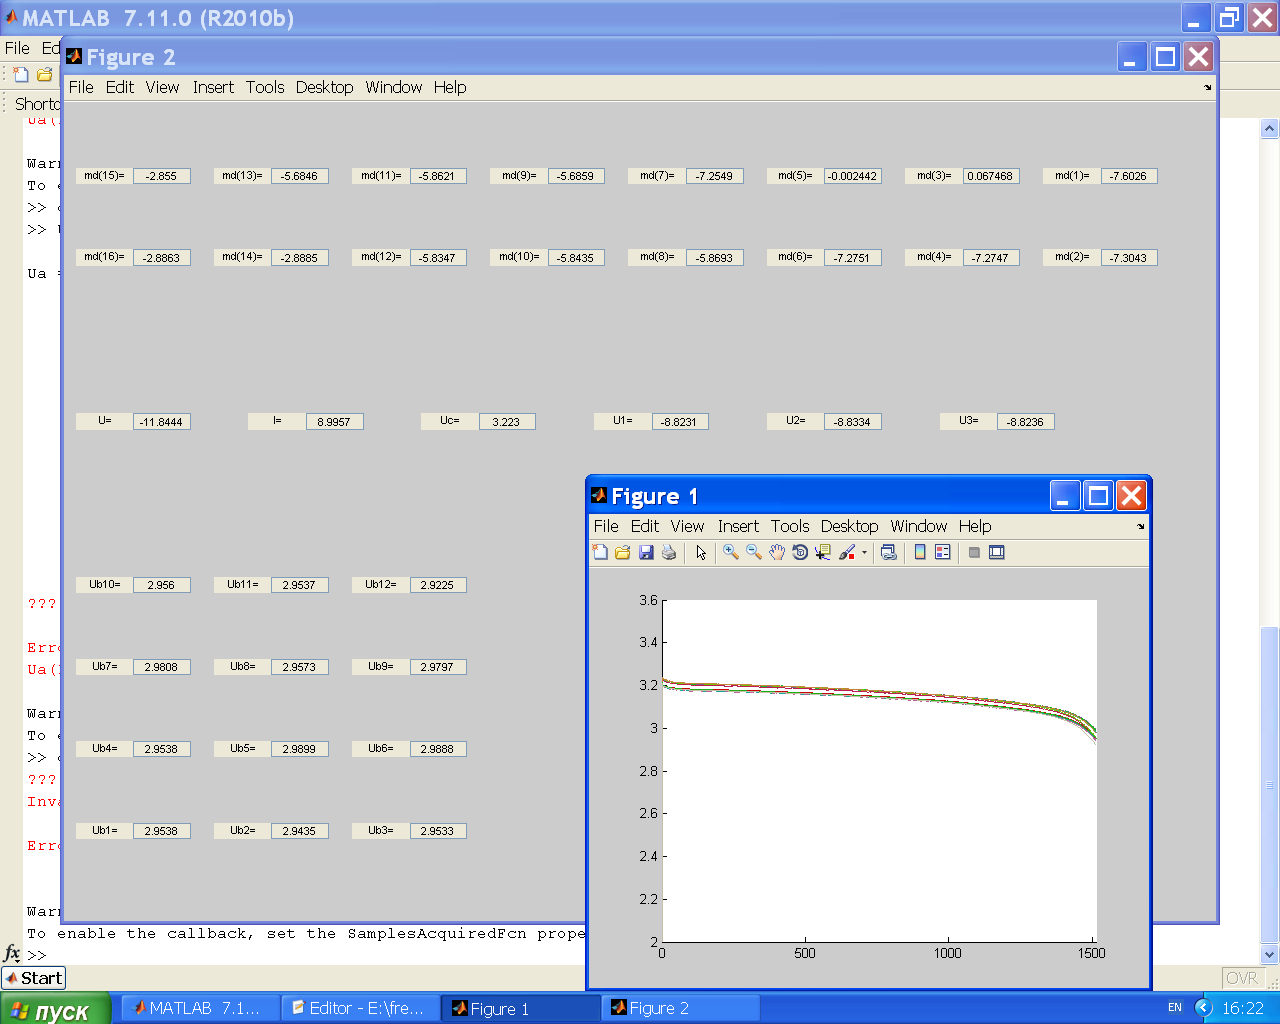 |
This is battery charging experiment. The battery consist of 12 elements. All 12 elements has a little difference in their properties. The problem is to charge all elements with same portion of charge. So it is need to know state of charge of each element. For charge state estiomation extended kalman filter was used. The kalman filter show bad estimation then usual coulomb counting was used. DAQ toolbox was used to control special ADC/DAC card. Click here to see setup. |
|
| | ||
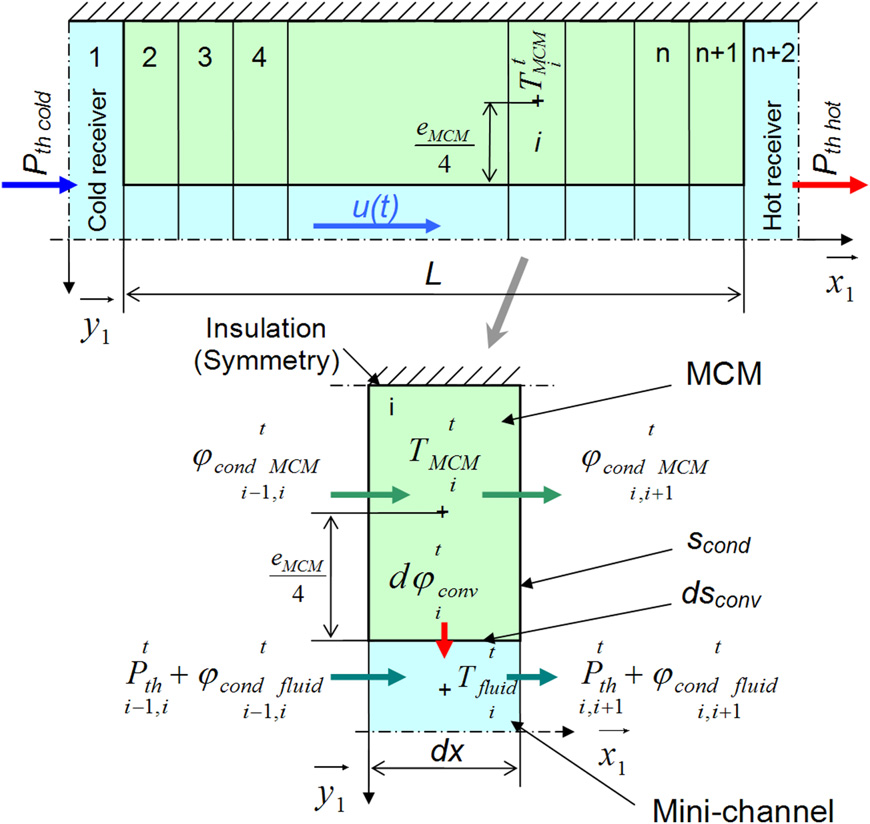 |
This is numerical simulation of magnetocaloric system (magnetic refrigerator). Gd is magnetocaloric material (MCM) that can take and release heat depending on applied magnetic field change. See Wikipedia article about magnetic refrigeration. The simulation is solving of PDE for heat transfer in fluid with motion and heat source/sink due to MCM. There are two coupled 1d diffusion equation with source and motion. It was solved with finite difference method. |
|
| | ||
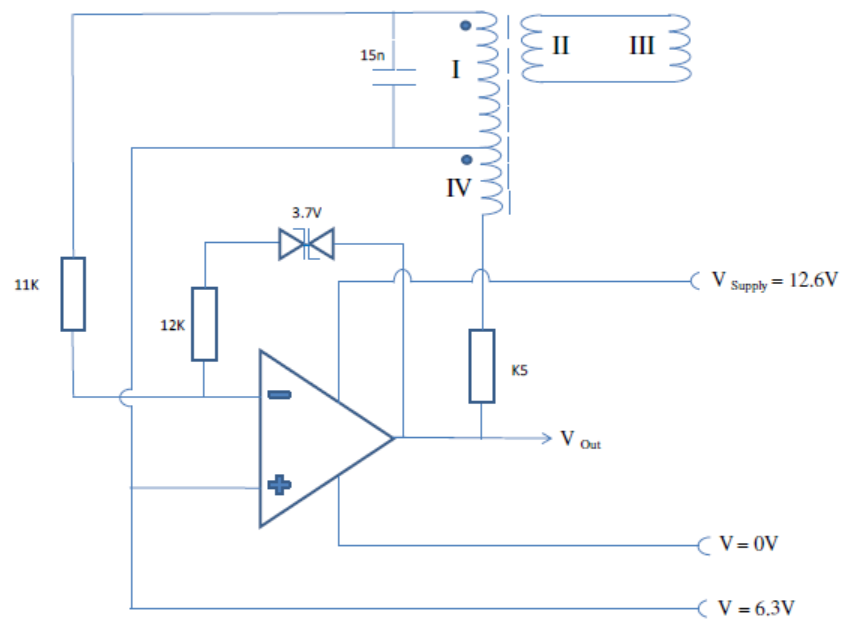 |
This is circuit simulation. The device is some kind of metal detectors that works by effect of inductance changing. The task was to define noise influence to detection quality. There was written 17 differential algebraic equations and solved in matlab with ode15s matlab solver. |
|
| | ||
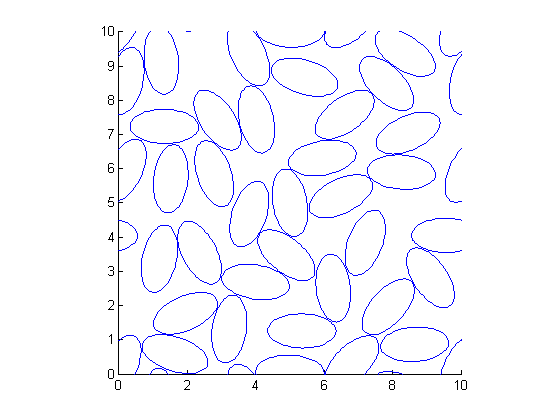 |
This is packing problem. The task is to pack square with fixed size ellipses. Orientations is random. Periodic boundary condition. Some kind of bisection method was used. |
|
| | ||
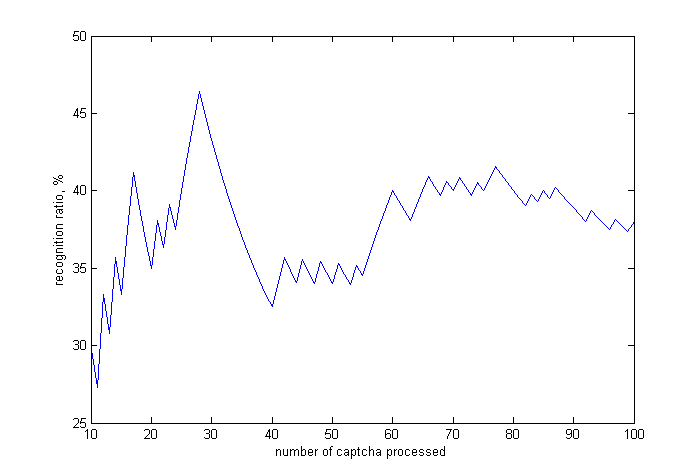 |
This is audio captcha recognition for some site. There are two parts: 1) extract samples, 2) recognizer, booth parts was made in matlab. Samples exctraction was made in some semi-automatic way. Then the recognizer was rewritten in C++ to get speed and able to compile in gcc for Linux servers. Reached recognition ratio is 38%, time is 0.2 sec per captcha. |
|
| | ||
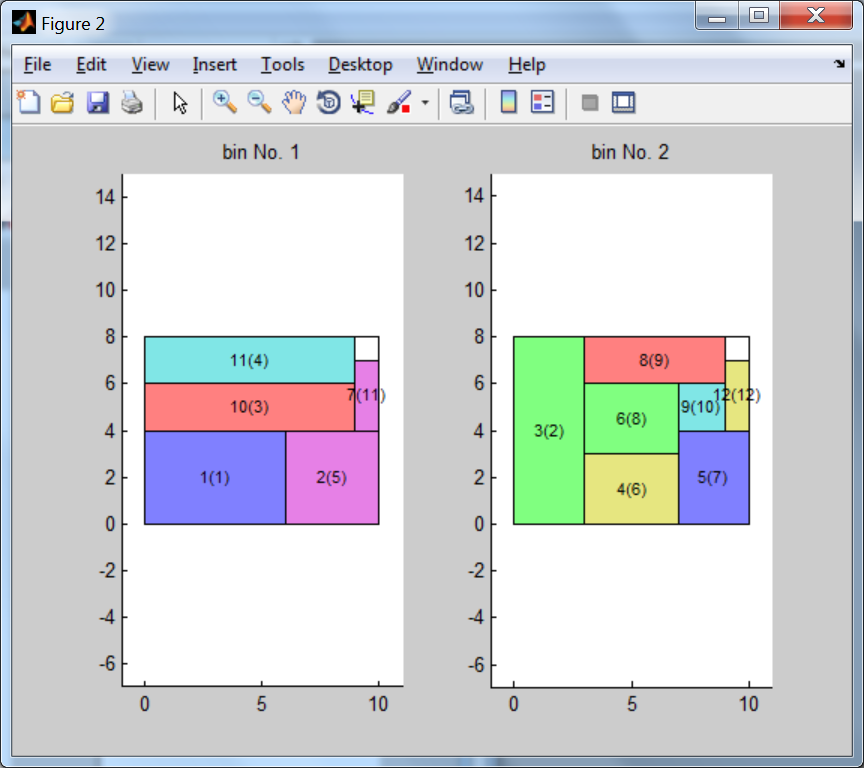 |
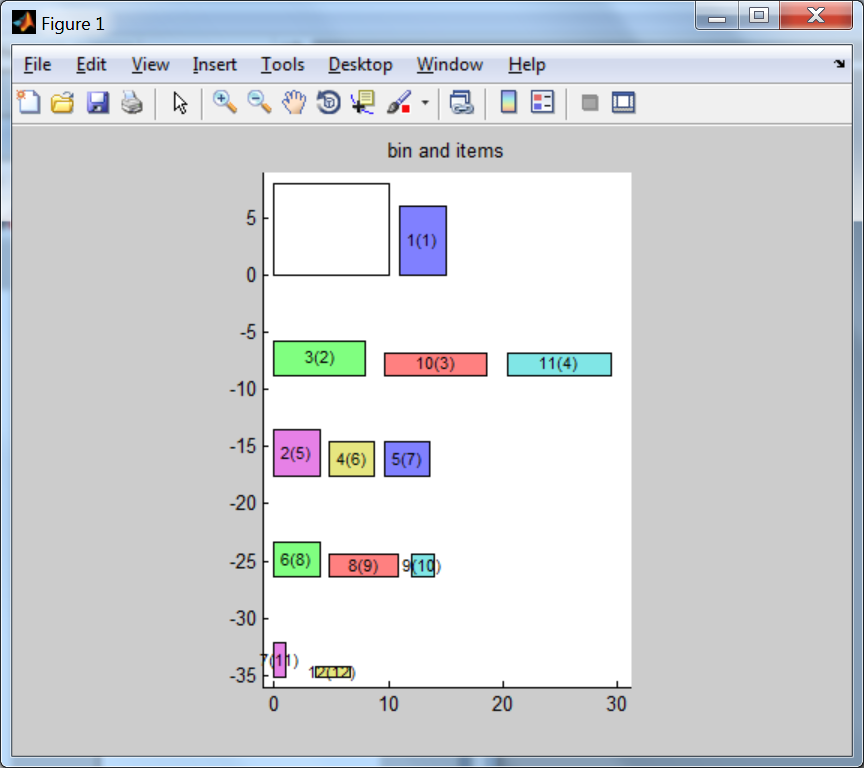
This is bin packing with touching perimeter algorithm: at each new item placing maximize score, defined as the percentage of the item perimeter which touches the bin and other items already packed. Before packing items is sorted: sorted items and bin |
|
| | ||
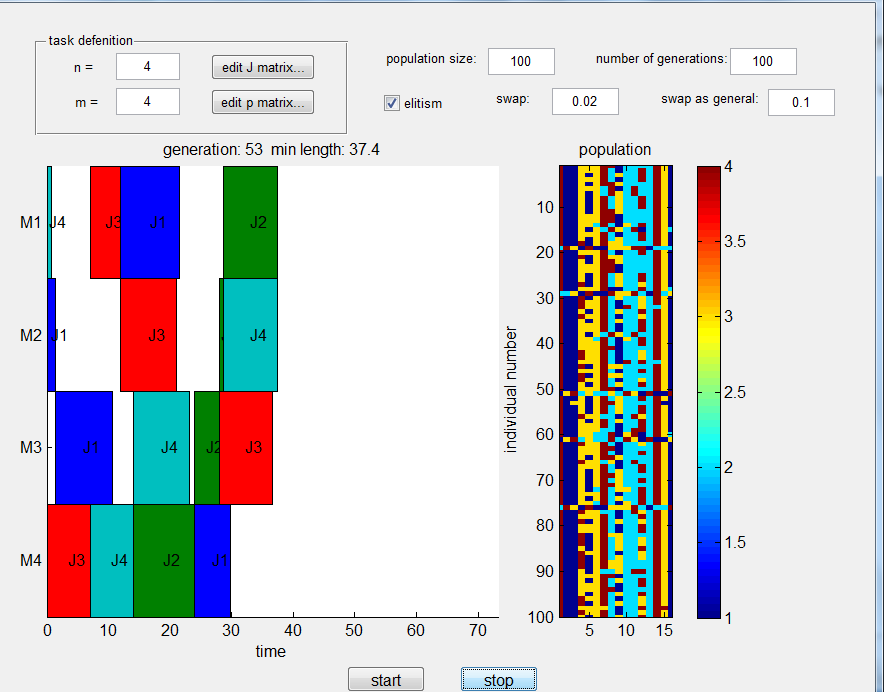 |
This is job-shop problem solved with genetic algorithm. Wikipedia article about job-shop problem. It is possible to edit machine sequence matrix and processing times. Gunn chart displayed. Animation at YouTube. |
|
| | ||
 |
It is Travelling salesman problem with Genetic algorithm. There is a set of cities (points) in 2d plane. Each city has road to each city. We need to find loop-path that will be in each city only one time and path length is minimal. There are lot of paths with different lengths. A path can have crossover with another path and mutate. See animation at YouTube |
|
| | ||
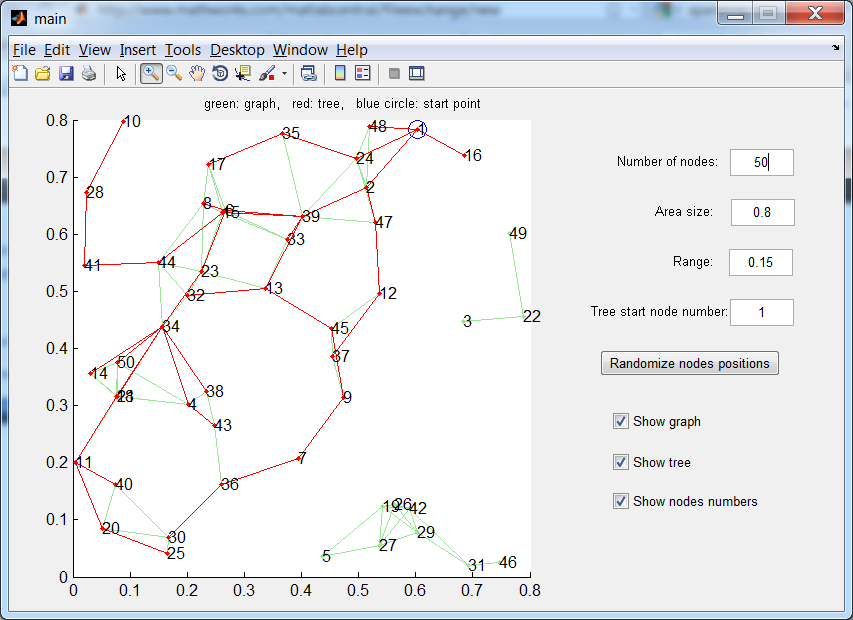 |
This is a spanning tree for randomized N nodes distributed in a x a square. Nodes have range R. The graph is defined as follows: if the distance between any two nodes is less than R then these two nodes are connected. In order to search through the graph the spanning tree is generated starting from any specific node s. Breadth-first search is used. GUI allows to specify the variables “N”, “a” and “R” as well as the starting node. |
|
| | ||
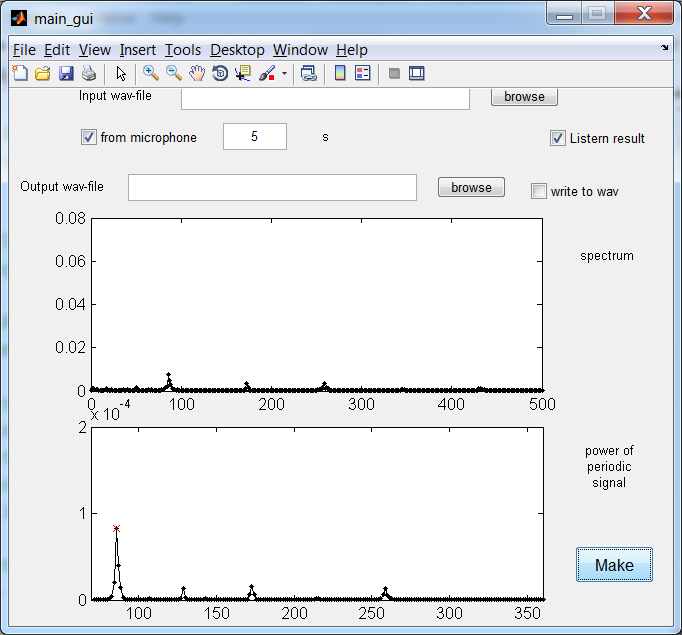 |
It is speech filtering GUI. The code detect fundamental frequency using fft. All frequencies except harmonics are deleted. It is possible to read from wav file or get sound from microphone. DAQ toolbox used. |
|
| | ||
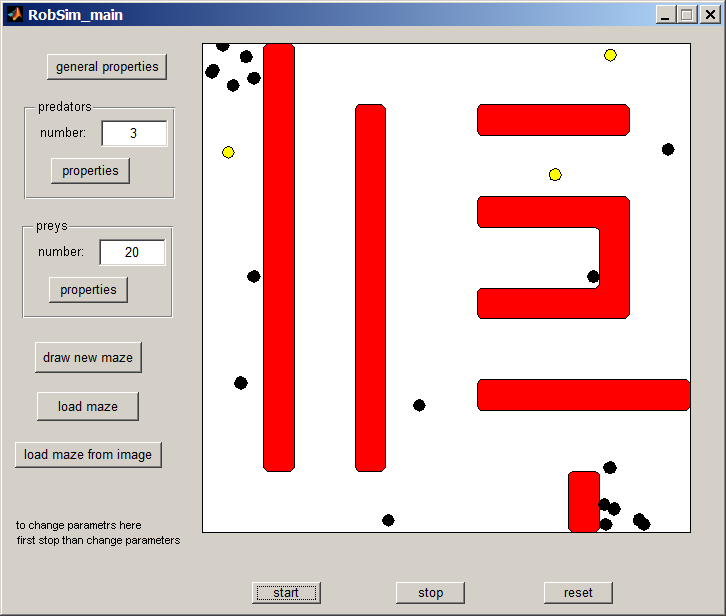 |
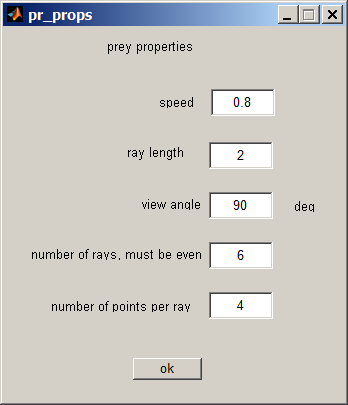
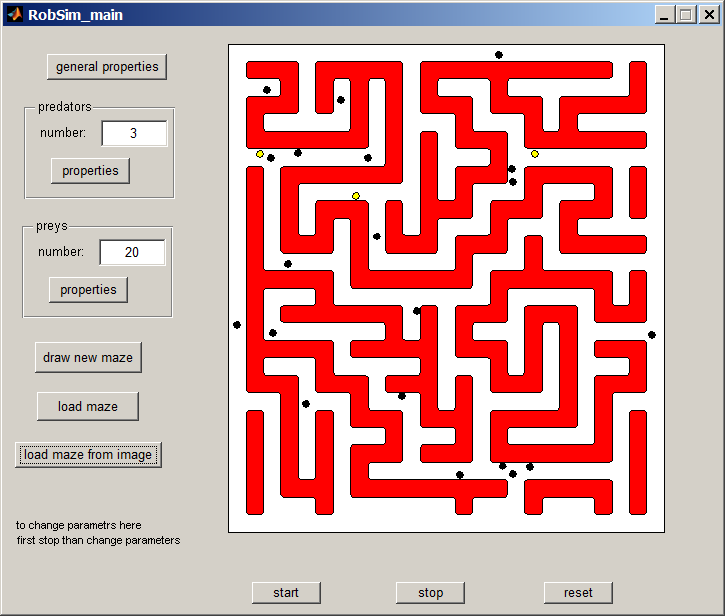
This is simulation of predators-preys problem. Predators and preys moves in a maze. If predator reaches prey then it eat it with sound. Prey disappear. Both predators and prey use same system based on two probes to avoid walls of the maze. They use dots to see each other. Only inpolygone Matlab function used. Predator behavior is to turn in direction of detected prey. Prey behavior is to turn in opposite direction to predator. There are addition windows for adjust parameters: general properties, predator properies, prey properties. maze can be loaded from image click here to see example. Also it can be drawn as sets of poligon. |
|
| | ||
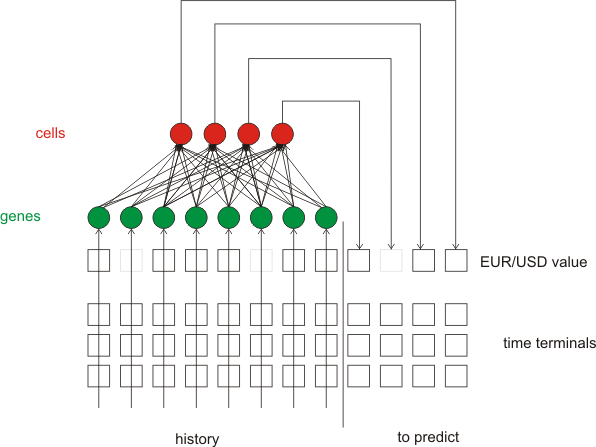 |
There was big project about EUR/USD curve prediction research. Handwritten digits recognition was made as described here: Explanation of the digit movies Then this concept was applied to EUR/USD signal. It was try to recognize general patterns in EUR/USD curves. Also genetic programming (pictured) was checked. A set of virtual traders move along history and best chose. Crossover mutations selection were applied. Gene Expression Programming was used. Also wavelets and sine/cosine extrapolations were checked. |
|
| | ||
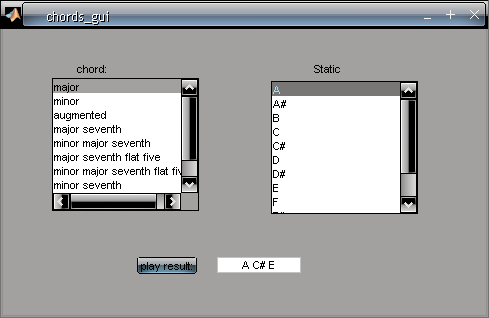 |
There was big project about sound generation and chords. There was made functions that converts note symbol to frequency and vice versa. Sound generation was made as pitching of main A4 note (resample) . Also Karplus-Strong Algorithm was used and sound generations as waveforms with arbitrary shape. |
|
| | ||
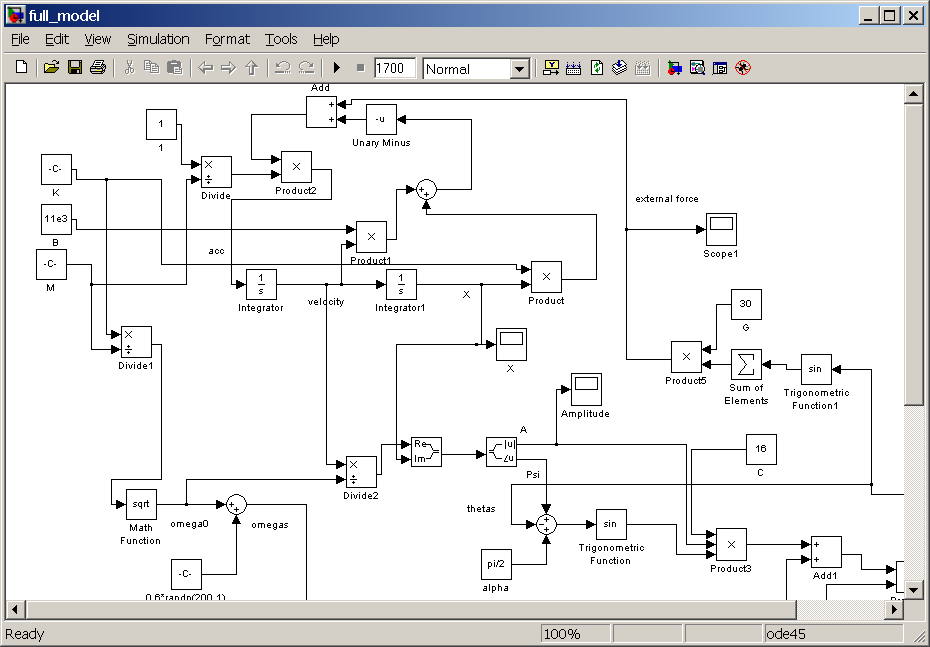 |
It is bridge pedestrian-induced oscillation simulation in Simulink. The bridge is represented as a weakly damped and driven harmonic oscillator. Differential equations are solved using integrators. Pedestrian number is increased during simulation until crowd synchronization effect achieved. |
|
| | ||
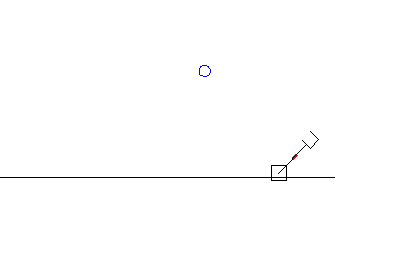 |
It is catapult simulation. The catapult consists of motor, gearing, arm, stopper, and ball. Stopper is small and red. It define initial angle of fly. It calculate all physics include motor rotor moment of inertia, torque curve, gearing. See animation at YouTube. |
|
| | ||
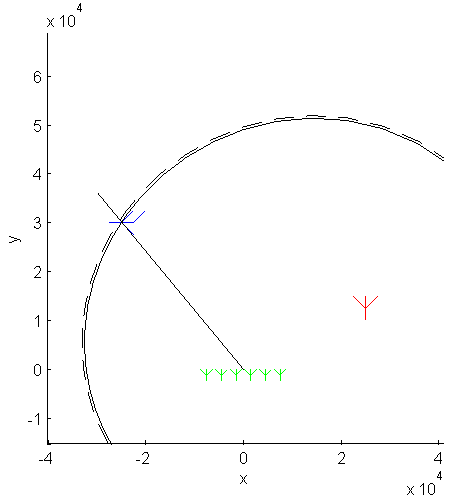 |
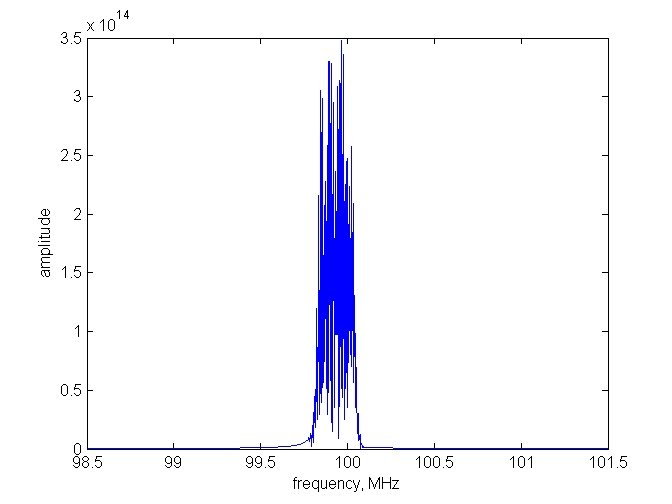
It is simulation of pasive radar. Red is radio station position. Green is radar station position. Radar station has several antennas. It is phased array. The signal from path radio station-plane-radar has time delay more than time delay of direct signal radio station-radar. It is ellipse of possible plane positions. The ellipse pictured on the picture. Focuses of the ellipse are placed in radar position and radio station position. Radio station is FM radio station. Click here to see spectrum of the FM signal. Doppler shift and delays and detection are simulated. All signal processing are made as work with function. It is time shift and frequency shift. Click here to see scheme of the radar. |
|
| | ||
 |
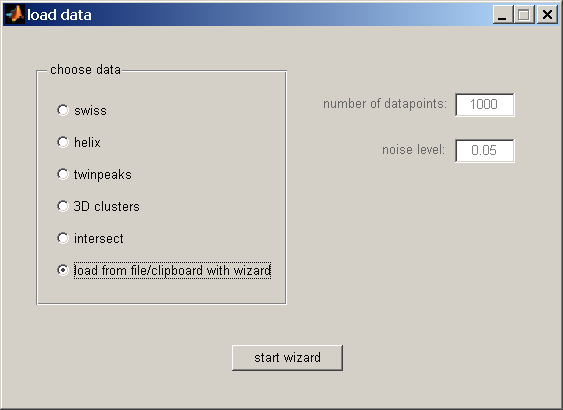
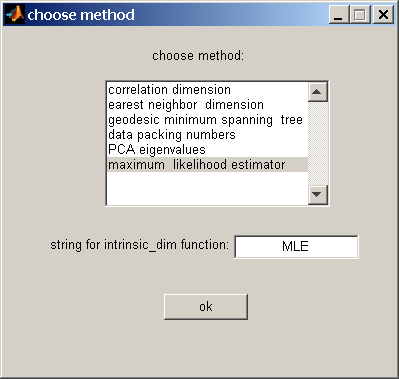
It is GUI tool for Dimensionality Reduction Toolbox. GUI starts with command drtool. Then appear main window. There are 3 steps: 1) generate/load data 2) estimate dimensionality 3) make mapping Load is in load window. It is possible to generate data or load data from txt-file mat-flie or clipboard. It is possible to load labels separate variable or one of column of data. Click here to see window for dimensionality estimation. Click here to see mapping window. Controls automatically appear/disappear depends on chosen method. Both input data and output data is posible to plot. The GUI was developed with help of Susanth Vemulapalli. |
|
| | ||
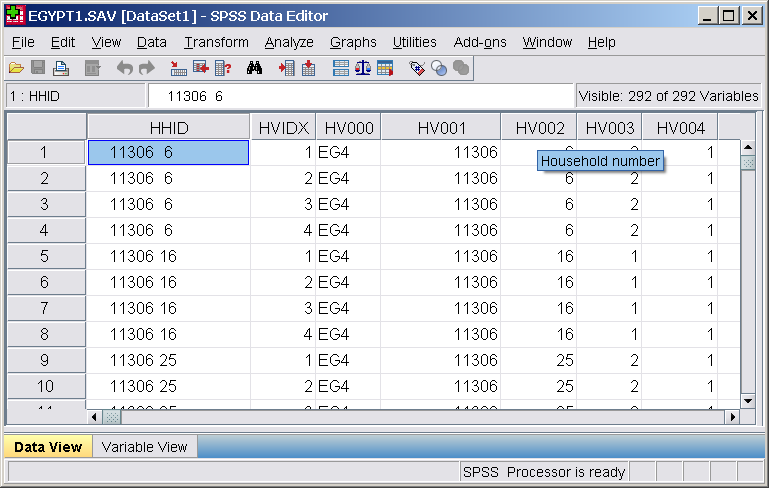 |
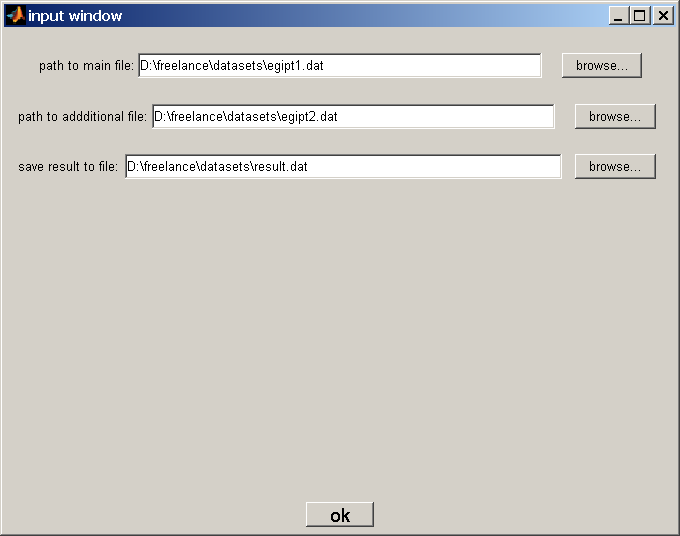
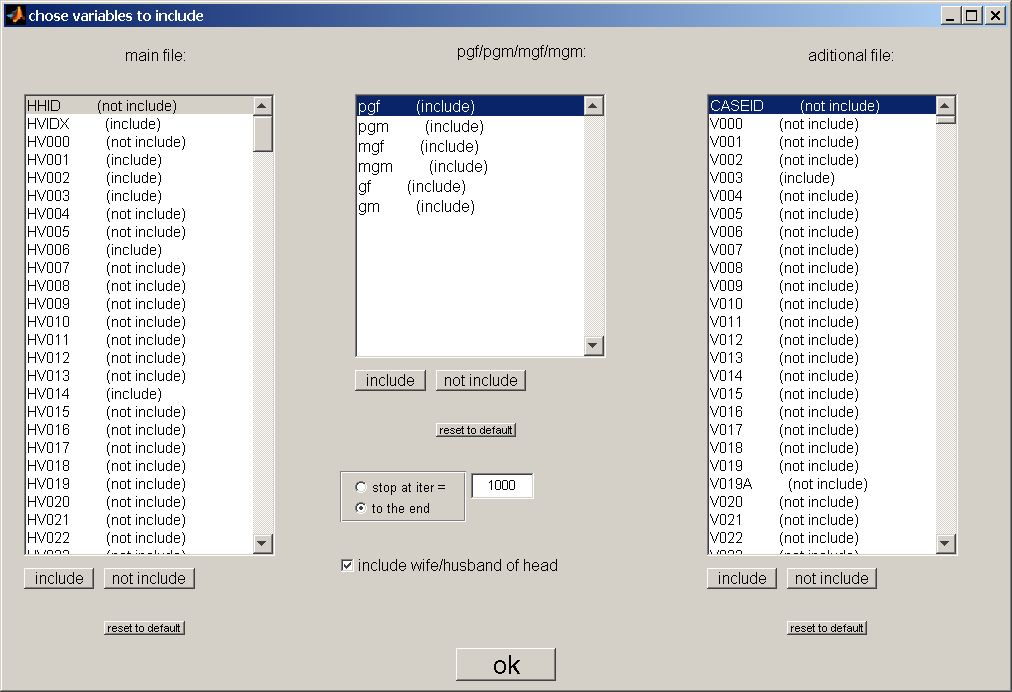
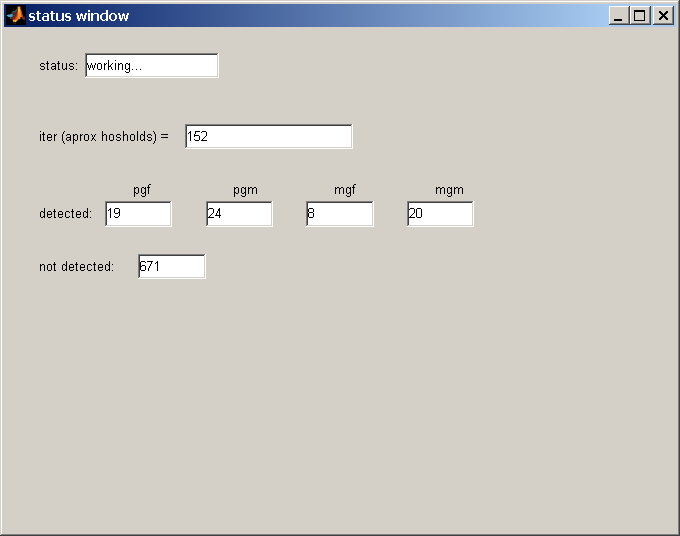
It is work with datasets The task is two merge two datasets. The datasets are statistics about households in Egypt. Initial files were converted from format of spss to text files to be able to work in Matlab. Matlab script read synchronously two files. Synchronization parameter is household number. Then merge this to files in one file result.dat. It calculate also if there are paternal grandfather, paternal grandmother, maternal grandfather, maternal grandmother in the household. It use info about relationship to head of household member and some other. So result.dat has new columns pgf, pgm, mgf, mgm, gf, gm. The program starts with file input window then comes columns chooser window then program start works. status window shows the progress of the work. |
|
| | ||
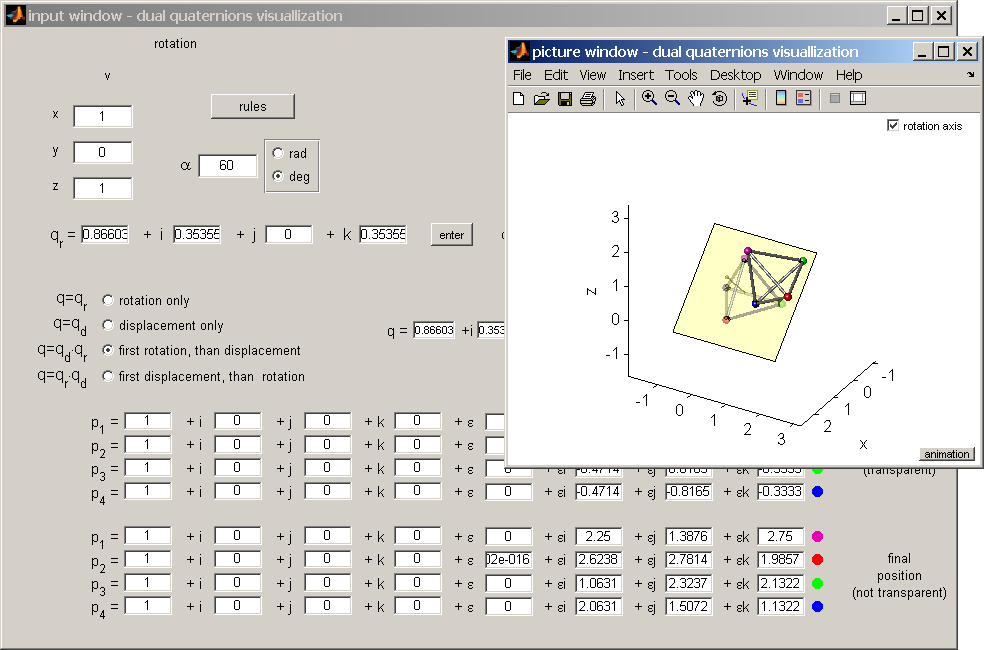 |
It is using of dual quaternions for rotation and displacement of tetrahedron. Quaternion class was taken from matlab files exchange I write dual number class. And write new class of dual quaternion that inherit both quaternion class and dual number class. Overloaded operators: + - * / conj. Input and picture separated in two different windows. There is a rules window can be called by pushing special button. rotation and displacement can be animated or not animated. |
|
| | ||
| Small matlab projects | ||
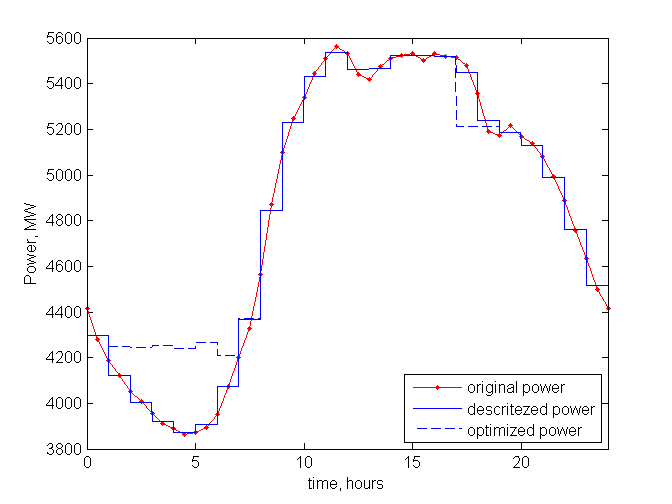 |
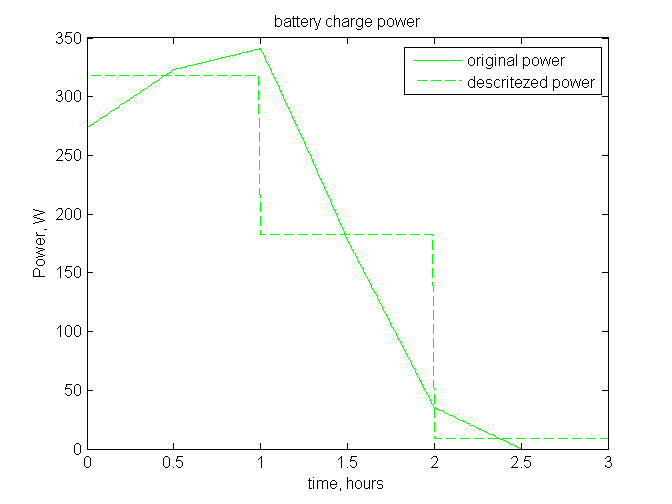
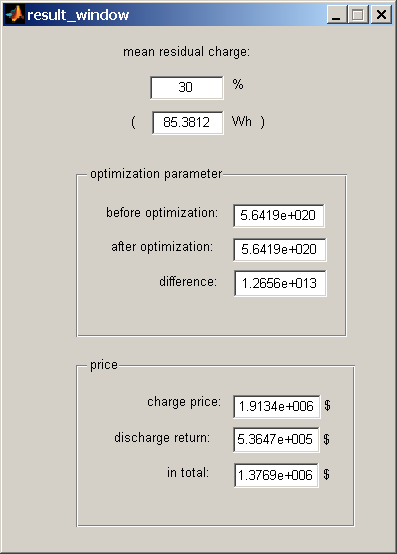
It is optimization for loads of charging/discharging of electric vehicle The graph shows energy consumption of Singapore. Consumption is big at day and small at nigth. The price of electricity at night is much smaller. One battery has some special charge and discharge characteristics. The task is to make charging/discharging of cars at some special times to increase load at night and decrease load at daytime. All values is discretized with step 1 hour. The task is least squares technique with constrains. Matlab function "quadprog" from optimization toolbox were used. It optimize quadratic function with constrains. The program begin with input window. Then calculations are made. Then appear optimazed load graph, cars fractions histogram and result window with numbers. Click here for big image. It is task from getacoder.com |
|
| | ||
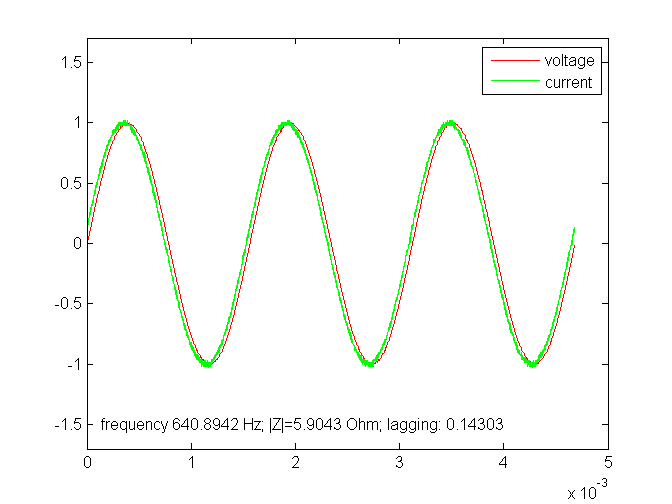 |
It is proggram that make process of obtained data in same experiment. The data is voltage and current in txt-format. It was measured with PicoScope. It is digital oscilloscope that connected to computer. In picosope program data can be saved in txt-format. Written matlab program find Channel A and Channel B data define units and make voltage and current data in V and A. Channel A gives voltage. Channel B gives current (shunt resistor 0.5 Ohm was used). The main task is to define small lagging between current and voltage. The programm define zeros of noised signals and calculate frequency. Lagging is calculated from difference of normalized voltage and normalized current. Click here for big image. |
|
| | ||
 |
It is visualization of the theorem: Successive reflections in two axes that meet in a point O is equivalent to a rotation around O through double the angle between them.(in the space). 3d axes and UI controls is on the one figure. Click here for big image. |
|
| | ||
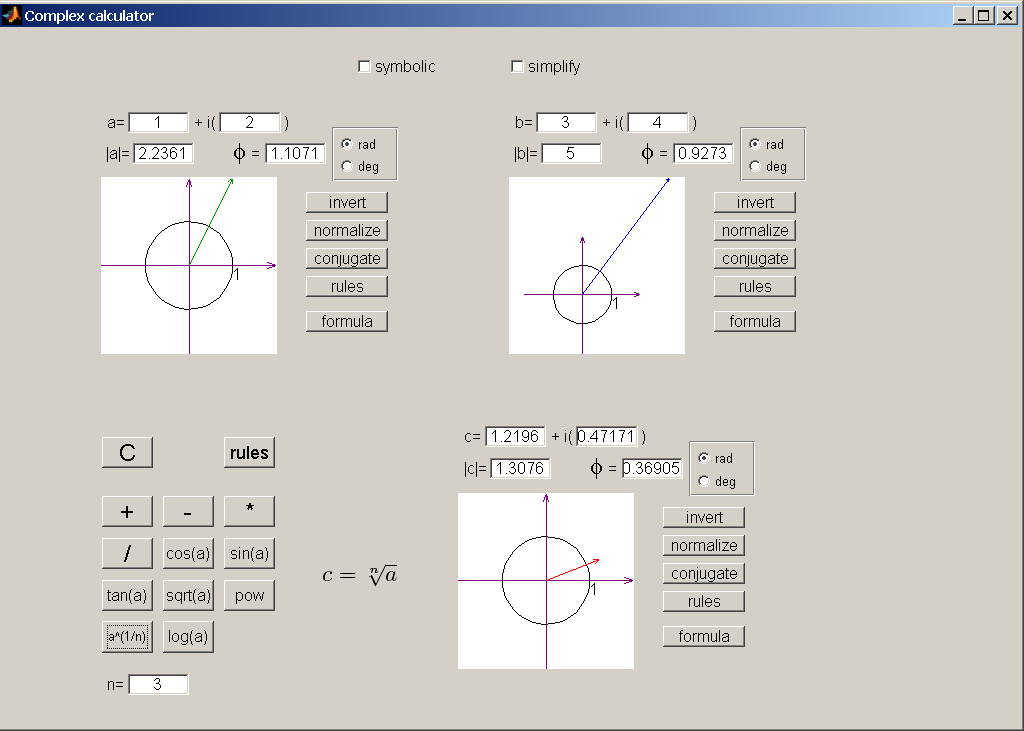 |
It is complex calculator. Each of three complex number has visualization as vector on complex plane. There are rules and formula view. For angle radians or degrees units are used. Functions: +, -, *, /, sin, cos, tan, log, ab, square root, n-power root. Calculator can work in symbolic mode. This calculator was made without matlab gui editor "guide". Only functions like "uicontrol" were used. One function is used to make 3 complex inputs. Click here for big image. |
|
| | ||
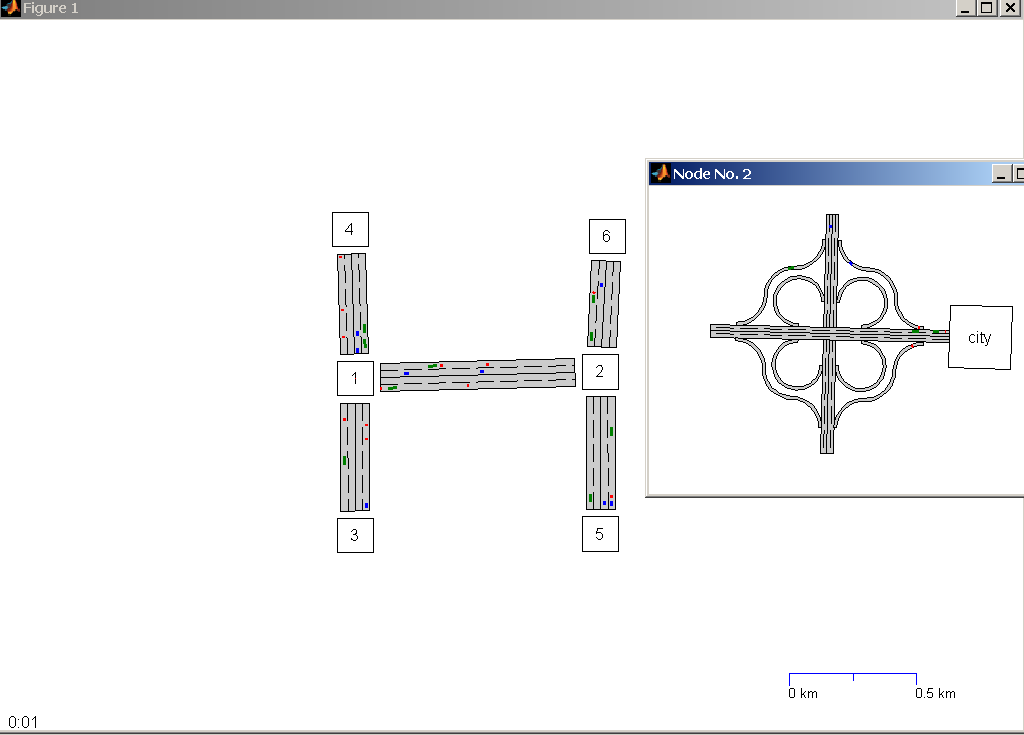 |
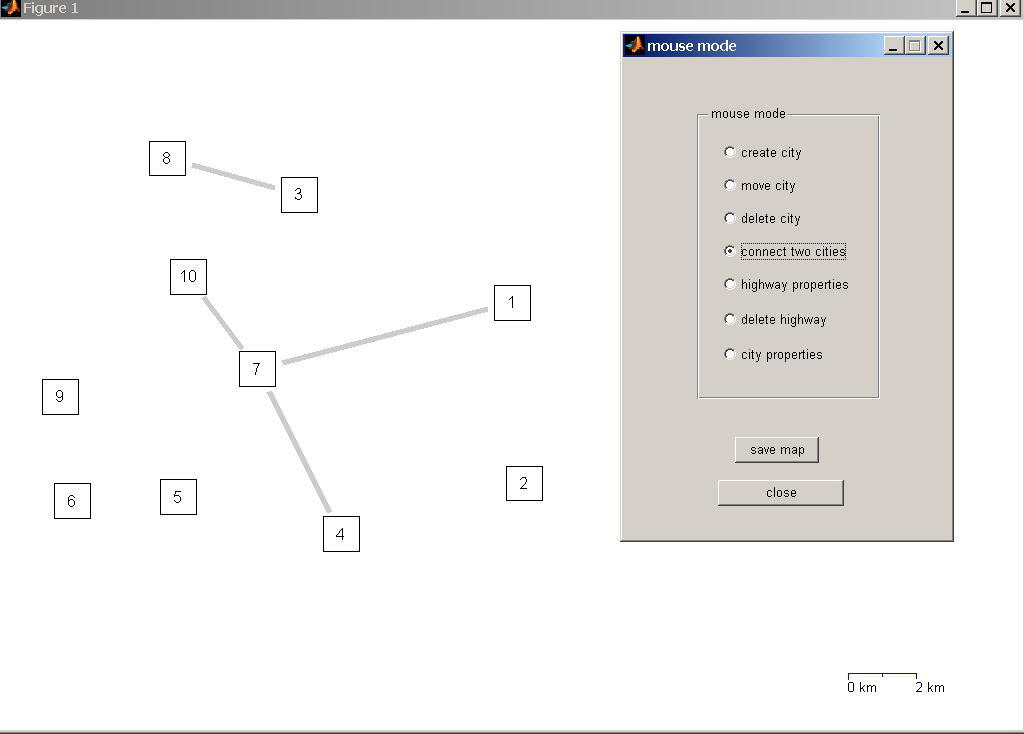
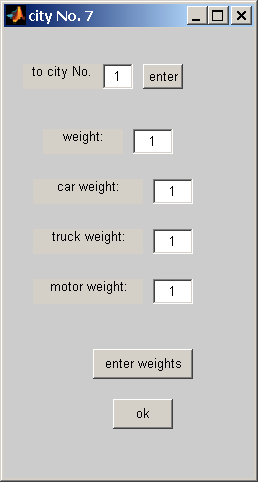
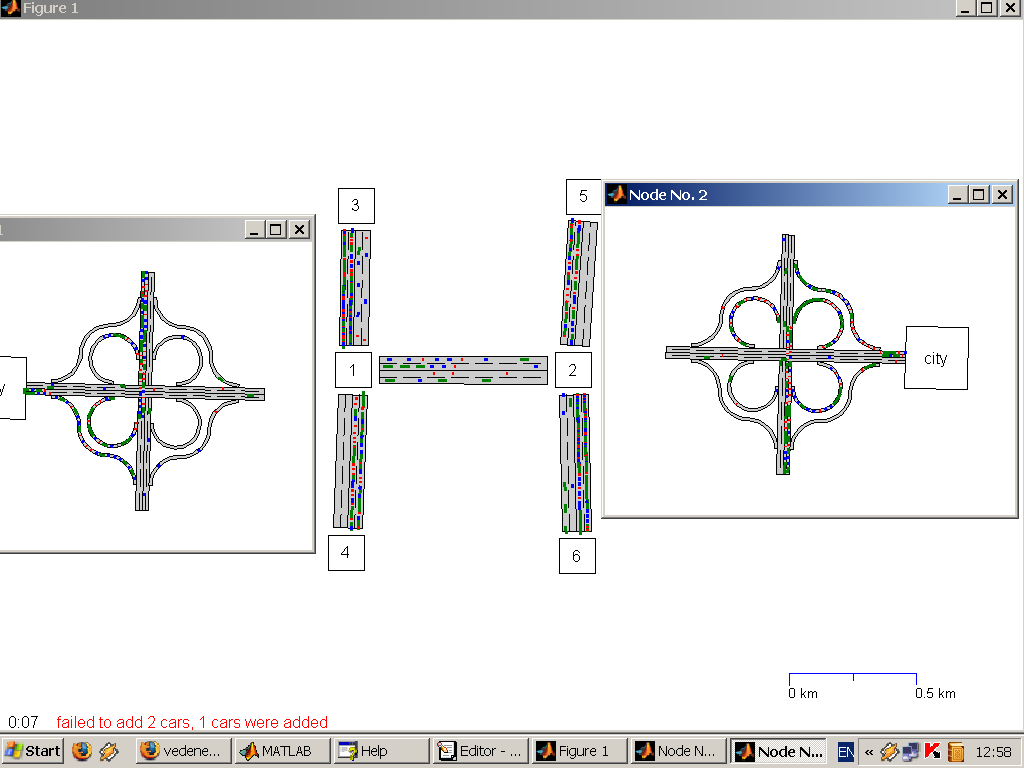
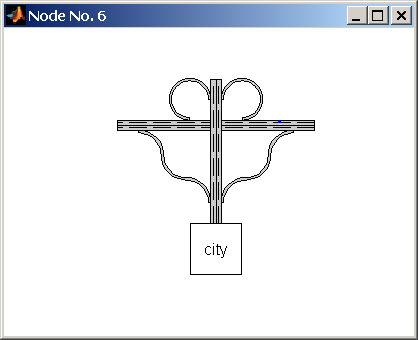
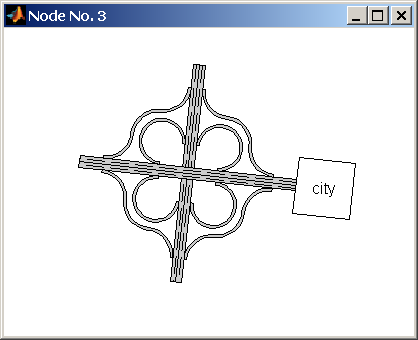
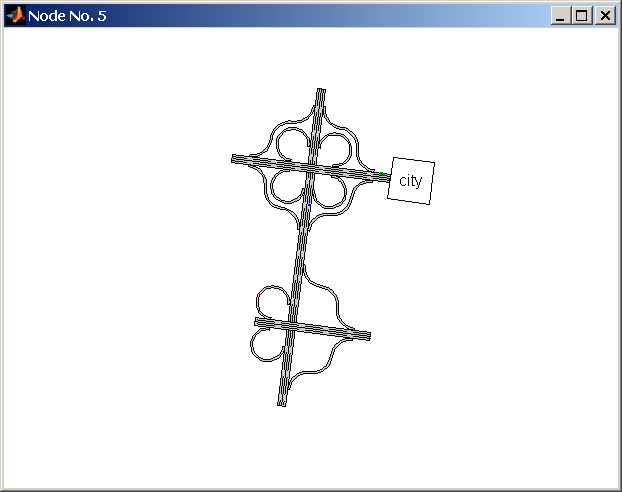
It is traffic simulations. First map is made with map constructor. Nodes can be moved and connected with mouse. Nodes have properties. Highways have properties. Generated map is loaded in simulation part. It is animations of moving of differnt cars. Animation can be turn off to accelerate the simulation. Frame skipping can be changed to achieve optimal resources consumption for drawing. Every objects organized as cell arrays. Cars can make jams. Many parameters of cars are recorded fuel consumption include. Cars routes are generated randomly. Cars generations is poisson process. Cars have logic to drive around other cars and not strike. Each node can be opened by clicking to se detailed moving of cars. 1-connection, 2-connections, 3-connections, 4-connections, 5-connections are possible. It was long project for several months. Click here for big image. It is task from getacoder.com. |
|
| | ||
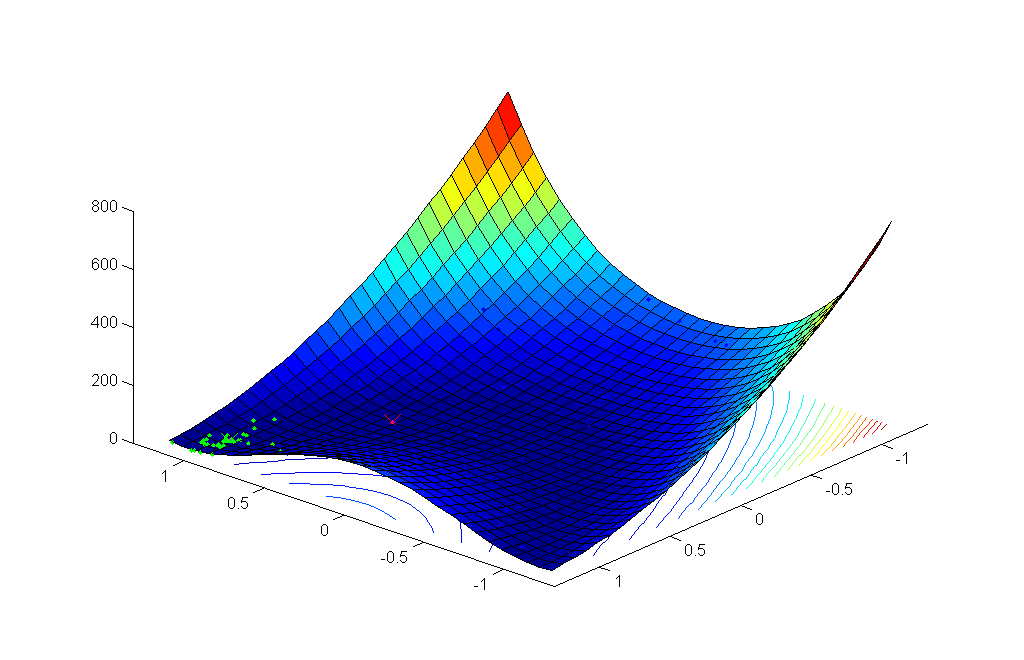 |
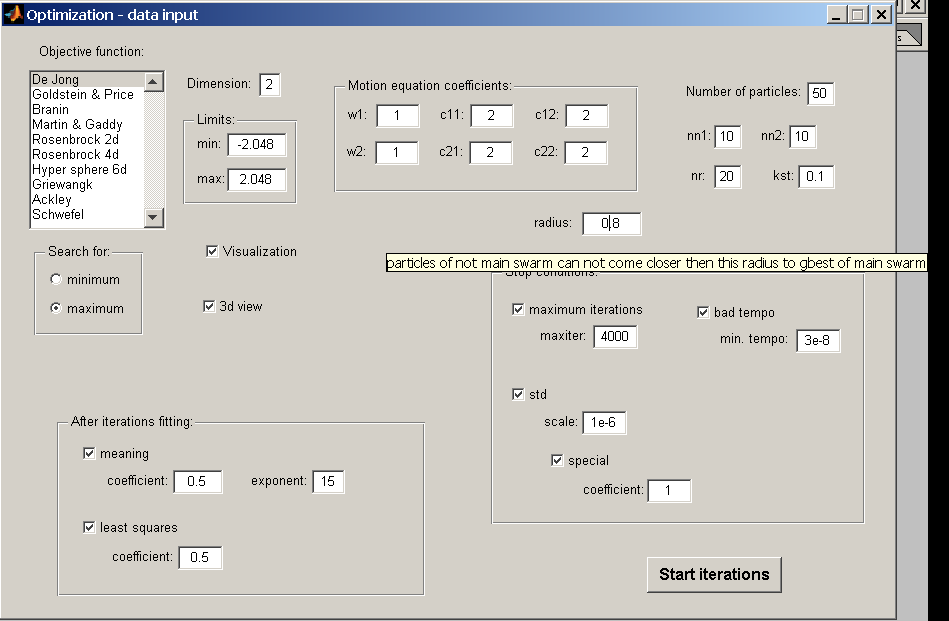
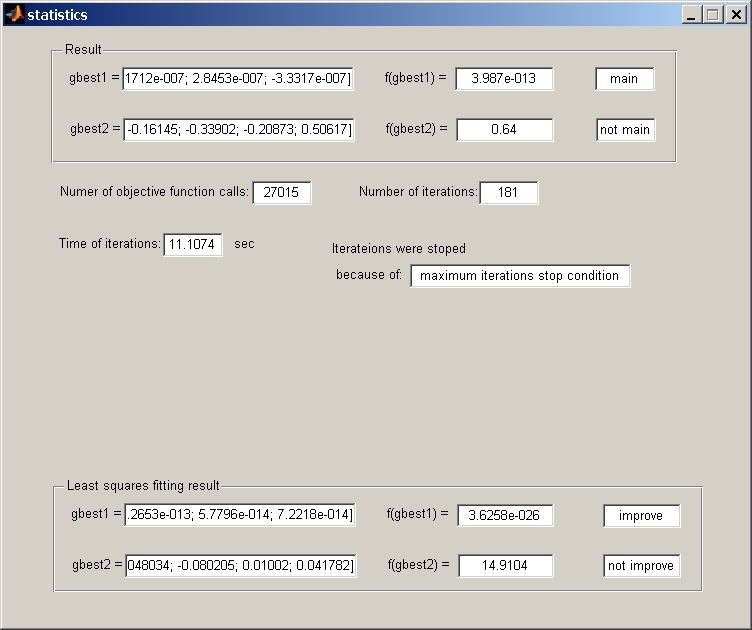
It is particle swarm optimization (PSO). See wikipedia for details about PSO algorithm. The task is to find minimum or maximum of some function. It is not basic PSO. Two swarms are used. Particles of not main swarm cannot come closer to some distance to global best position of main swarm. It prevent stacking at local minimum. There are random and neighborhood particles also. Program start from parameters input window. Then optimum searching begin with animation of particles moving. Iterations stopped when occur some of the stop condition. Then appear statistics window that shows elapsed time, number of functions calls and other. Click here for big image. It is task from getacoder.com. |
|
| | ||
 |
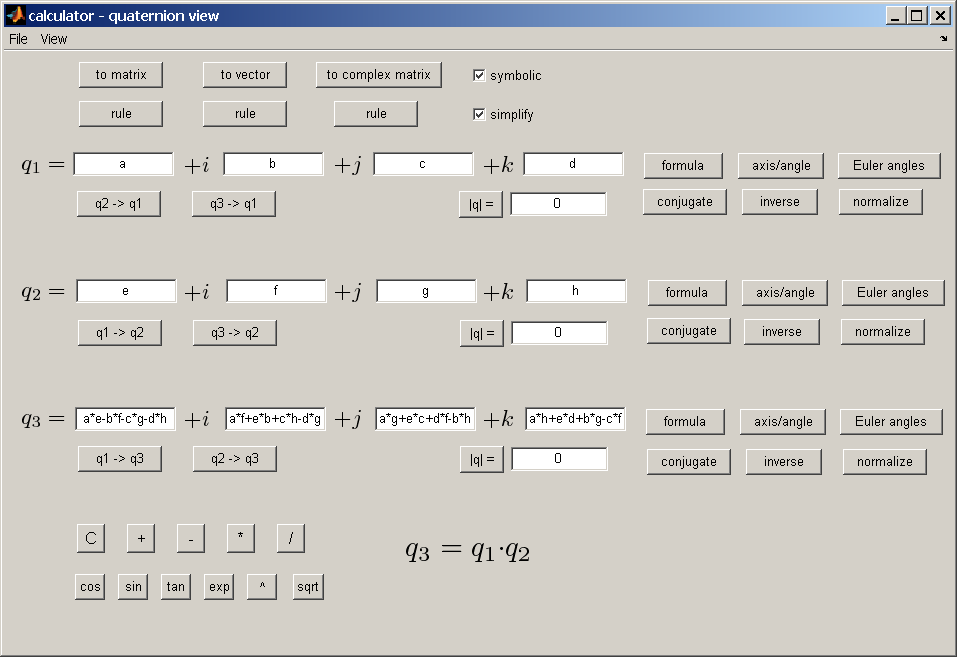
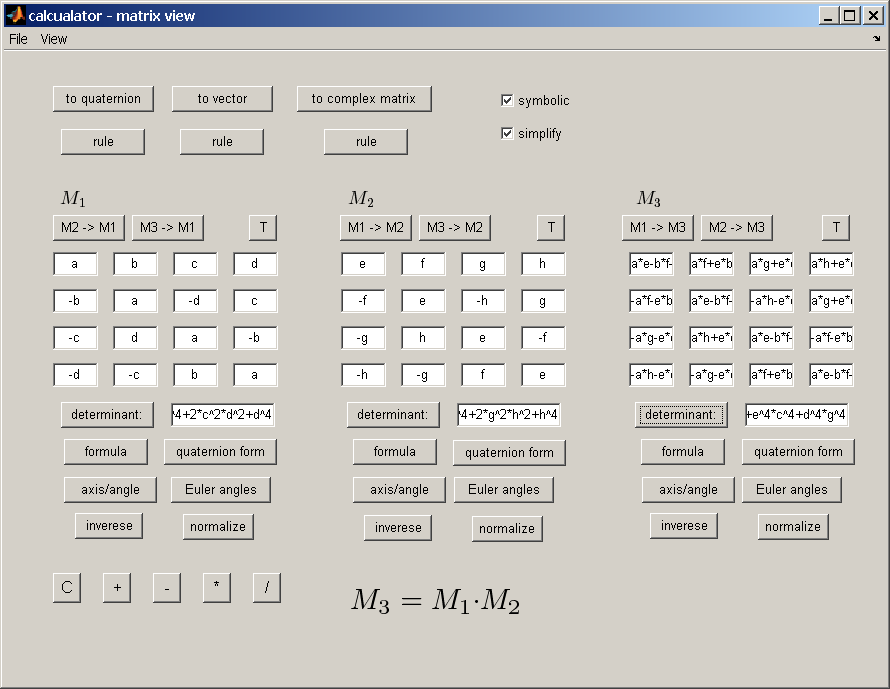
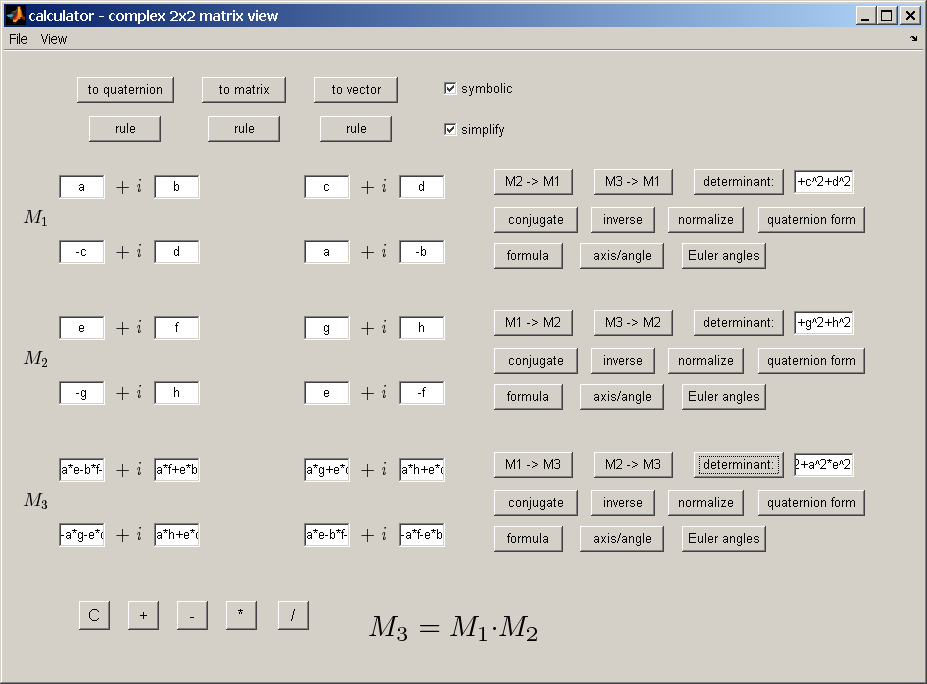
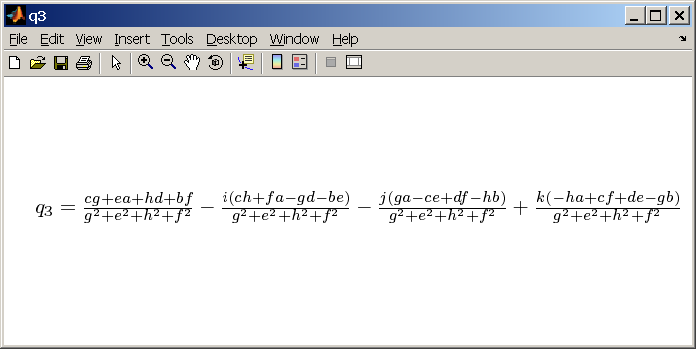
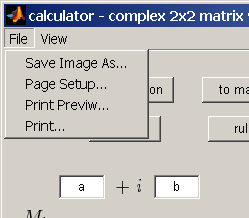
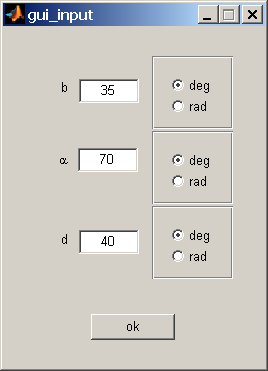
It is symbolic quaternion calculator. It can work symbolically with quaternions. Addition, subtraction, multiplication, division, sine, cosine, tangent, exponent and exponentiation are possible. Symbolic toolbox is used. It has four views: quaternion view, matrix view, vector view, complex 2x2 matrix view. See Wikipedia for more details about this representations of quaternion. There is "formula view" button to see formula. It is possible to save window image to file and print. There are printing settings: page setup, print preview. Click here for big image. |
|
| | ||
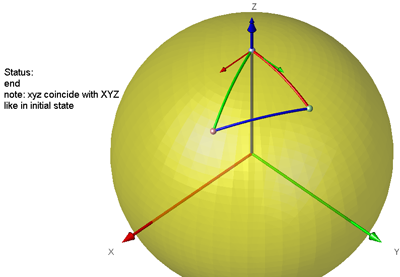 |
This is sphere rotation animation. Some sequence of 6 rotations of sphere is closed. The rotation are made with quaternion multiplication. There is GUI input for angles. |
|
| | ||
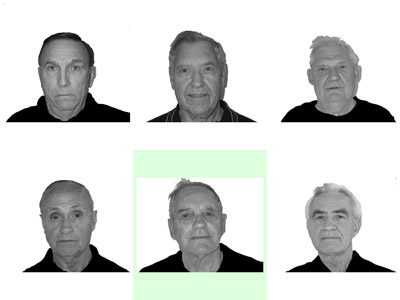 |
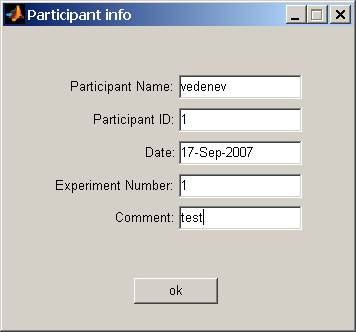
This is a program for face memory. Psychtoolbox was used. This toolbox allow to work in full screen mode. There are several screens with 6 photos in random order. Chosen photos names are saved to txt file. Program settings and particant info were made as GUI. I found this task at rentacoder.com. I made this task for 5 days in total. The buyer set me a good rate. |
|
| | ||
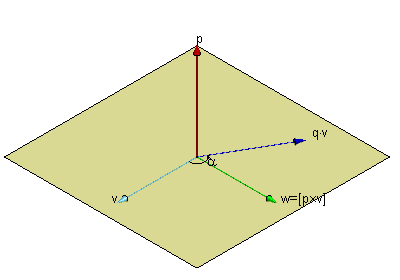 |
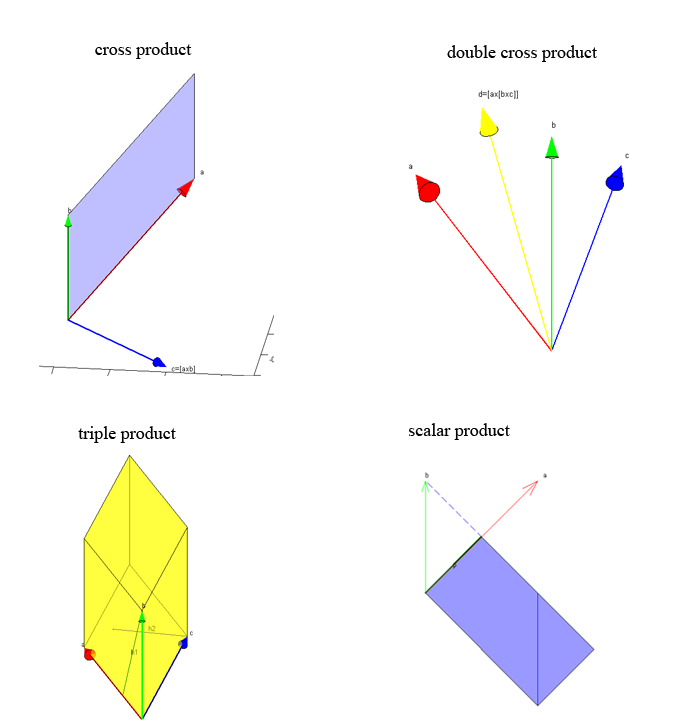
The task was to make visualization of of vector products: cross product, triple product, double cross product, scalar product. I made arrow function that draw one 3d arrow with cone tip. See other pictures. The continuation of the project is rotation using quaternion. I use quaternion toolbox. Click here to see small animation movie of vector rotation. I found this task at kasamba.com. I made this task for 2 days in total. The buyer was satisfied and set me a good rate. |
|
| | ||
 |
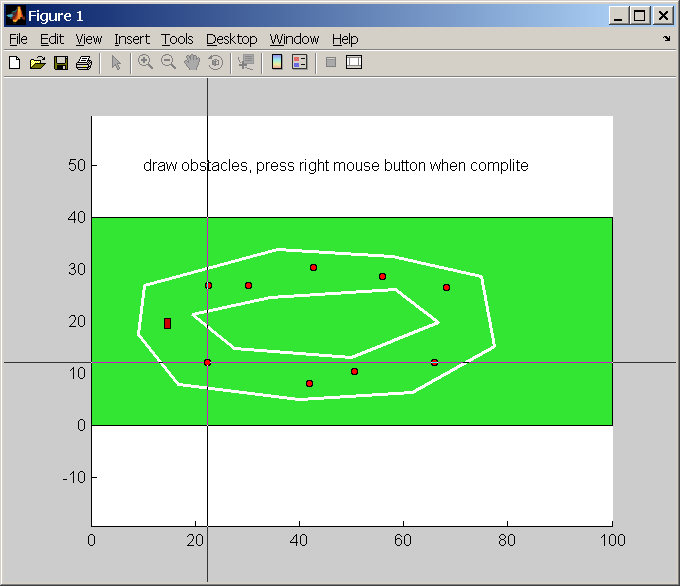
It is simulations of how robot-vehicle drive around obstacles keep inside track limits. The vehicle has special invisible sensors that helps drive around obstacles and keep inside track. Programs starts with drawning track then user put vehicle and obstacles. Then vehicle starts move in 2d view or 3d view. See move at youtube. It is task from getacoder.com. |
|
| | ||
 |
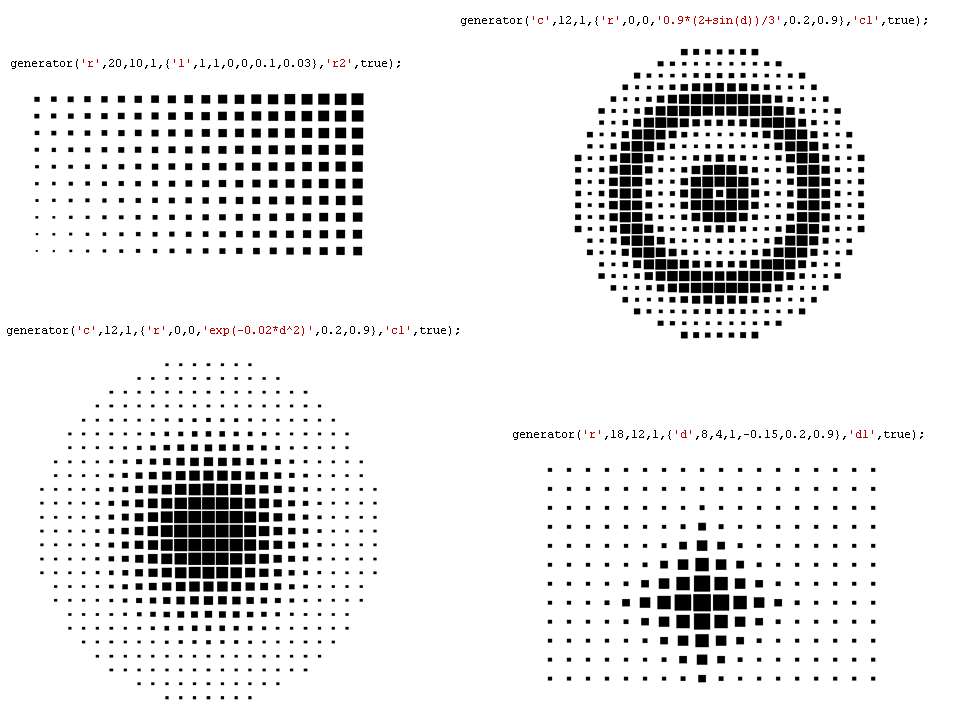
The task was to make figures from squares with gradient of square size with saving to eps-file in MATLAB. I made five MATLAB functions. The main function is generator.m, format: generator(figure,[sizes],T,gradinfo,filename,visible) gradinfo is cell array, format: {GradientType,[vx,vy],[formula],x0,y0,[a0],v,amin,amax} It is possible to draw rectangle, diamond and circle. Gradient types are linear, radial and diamond. It is possible to use formula for gradient behavior. Click here to see other pictures. I found this task at rentacoder.com. I made this task for 3 days in total. The buyer was satisfied and sent me a bonus. |
|
| | ||
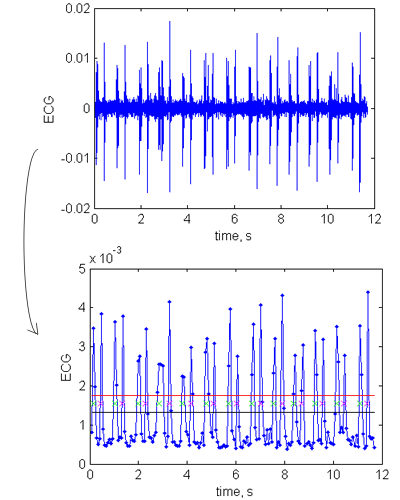 |
It is calulating of heart rate from ECG wav files. Absolute value of the signal is used. Noise is decreased by averaging when resample. Peaks detection is made with cursor that move along the curve. Too levels is used to prevent influence of noise. Because hear sound is doubled: rat-tat, rat-tat... , then it separate peaks to: firsts peaks, it is peaks number: 1,3,5,...; seconds peaks, it is peaks number: 2,4,6,... Period is distance between firsts peaks or second peaks. It calculate this difference and give mean value as result. Also it calculate standard deviation of this period |
|
| | ||
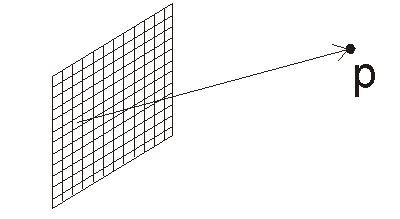 |
It is calculation of electric field from charged plate. The plate is break in to small squares. Each square is small enough to be considered as point charge. The code summarize contributions of each square with Coulomb's law. I found this project at liveperson.com |
|
| | ||
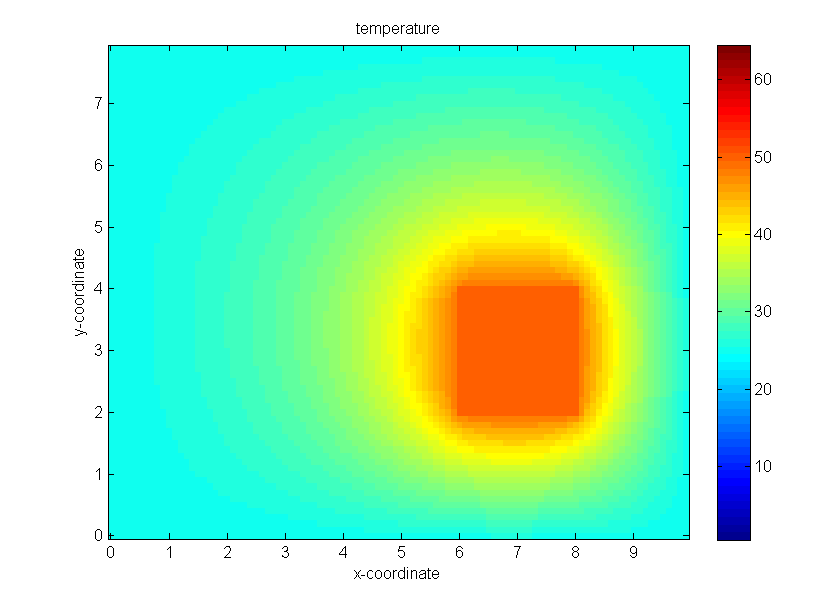 |
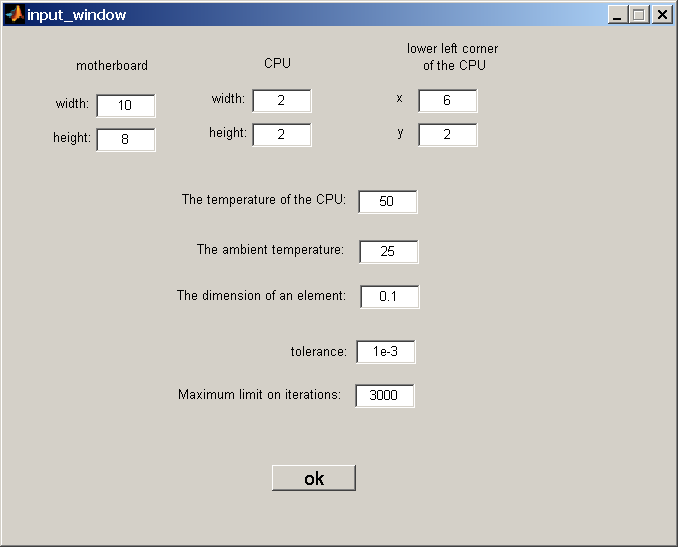
This is simplified simulations of motherboard with CPU heating with Finite Element Analysis. Mesh is rectangular.Each element is mean of neighbors. GUI is used for numbers input. I found this project at liveperson.com |
|
| | ||
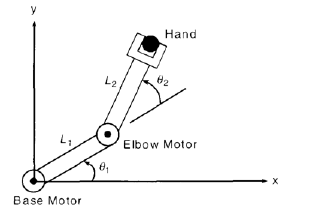 |
It is two link manipulator animation task. For angles are used polynomials. Linear equations system is solved to find polynomials coefficients. Acceleration and velocity of arm at initial and final points must be zero. Click here to see small arm animation movie. I found this task at rentacoder.com. I made this task for 2 days in total. The buyer was satisfied and sent me a bonus. |
|
| | ||
| | ||